- Monday, April 5th, 2010
- behavioral leapfrog
-
Earnings season is upon us and pretty soon stocks will be gapping up or down based upon whether an extra penny was found or lost. That is, whether it was found or lost versus expectations.
How those expectations get formed is the subject of today’s observations, although we’ll only scratch the surface. Management guidance is the biggest anchor for estimates; its role in earnings (and stock) management is a subject for another day. Neither are we going to focus on quarterly estimates and results, nor the “earnings surprise” metric and how it’s used analytically.
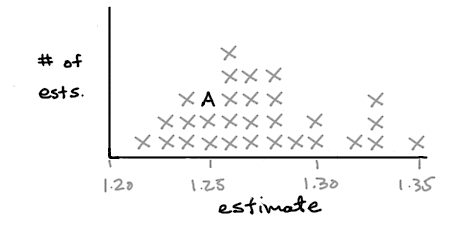
Instead, we’ll start with this simple histogram:

It is a map of what analysts think the earnings per share of a company will be over the next year. It serves to define the market’s expectations, and how it morphs over time will say a lot about how the company’s stock will perform relative to the market. Let’s look at one important factor in how the distribution might change. (I am indebted to Mitch Zacks, whose book Ahead of the Market contains the best written example of this phenomenon that I have seen.)
Let’s say you are research analyst “A”; you currently have an earnings estimate of $1.25, a little below the consensus figure of $1.27. (The range is $1.22 to $1.35.) It’s time to update your model, and you find that things are improving more rapidly than you had anticipated. The company’s sales look like they’ll be higher than expected and the operating leverage is kicking in, leading you to think that they will earn $1.65. Now what do you do?
Do you publish it as such? In one sense, you would be off the conceptual map, far above the consensus. Are you willing to bet that dramatically on your analysis? What will your research director say? How about the institutional sales people? You would be blazing new trails with that estimate — how confident are you?
Often what is easy to do in a situation like this is to think, “You know, if I use $1.45, I would be well above the high range. I’d still get credit for being right. There’s no sense being too aggressive on this.” And so begins a game of behavioral leapfrog. The other analysts covering the company will immediately notice the new number and think that they too should take another look. They will be asked questions about the estimate you published. Their reviews may discover some of the same improvements that you spotted, and their estimates will move higher, sometimes by a little and sometimes by a lot. Someone who can see that same $1.65 potential as you did will decide to top you with $1.50 or $1.55.
This can go on for quite awhile. Let’s say that the company does end up actually earning $1.65. As visibility improves, the corps of analysts will keep raising numbers; you will do so too, as you get closer bit by bit to the number you thought the company could do all along. The activity produces a relatively gradual movement of the consensus number until it reaches that higher plateau. (Since the consensus figure forms the denominator of the forward P/E ratio, this is a matter of some import.the research puzzle | For more on valuation issues, check out this piece on the “unpegged” PEG ratio.)
Many, if not most, quantitative approaches incorporate a factor based upon changes in earnings estimates because of the persistence of these moves. While the predictive effectiveness of the factor waxes and wanes in different kinds of markets — and works better for some stocks than others — it is worth studying because it illuminates the lag between the prospective improvement in a company’s performance and the pricing of its stock in the market.
All of this stems from our behavioral inclination to get comfortable with things as they are and to prefer small incremental changes rather than big ones. (A more famous frog analogy, that with the pot of warming water, also comes into play.) The process of investing is full of similar traps. Take, for example, the movement in and out of a holding at an asset management firm, where the same principle applies. Just as the hardest thing for an analyst to do is to make a full conceptual reversal (as from being below consensus to being high on the Street, or moving from a “strong sell” rating to a “strong buy”), so too for a portfolio manager to go immediately from shorting a stock to buying it in size.
Because that is the case, we have a choice to make. We can adopt strategies that take advantage of the game of leapfrog that we observe, or we can do our homework and, if the time is right, get out ahead of the army of frogs by taking the biggest leap we can.
