- Saturday, November 1st, 2008
- know the distribution
-
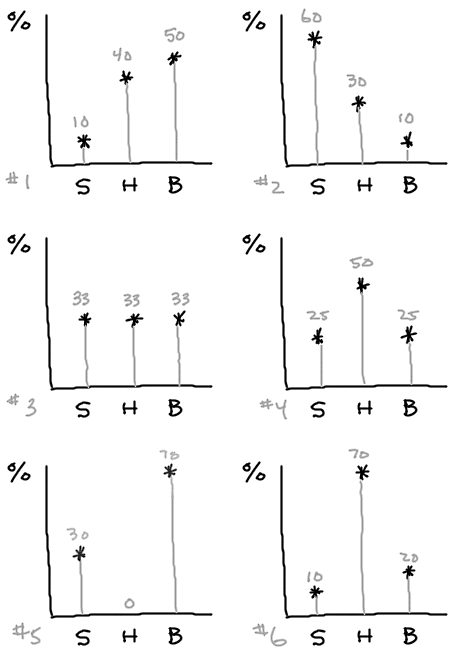
One of the many challenges in thinking about research performancethe research puzzle | This is a topic rich with intricacies. My first look at it on this blog was in “the research performance derby.” is dealing with the variant distributions of investment ratings that you see across firms. Here are six examples, using a simple snapshot of the percentage of sells, holds, and buys for each:
Where does the distribution come from? What is the “normal” distribution for a firm? Is it forced through some methodology or does it vary over time, in which case what does it tend to look like and why? These are all important questions for someone who is evaluating the “performance” of research.
The first distribution is one that is indicative of many sell-side firms, not fixed per se, but pretty consistent over time in its skew to the right. The second is not common, but there were valuation-oriented firms that had patterns like this in the summer of 2007.
The next pair illustrate firms that think about the world in a relative performance sense, with the one on the left always keeping a level distribution, and the one on the right also using fixed percentages, but with a higher allocation to the “hold” category.
The last two charts get at one of the most interesting questions in performance analysis: To what extent should a firm “have a view” or “pick its spots”? It’s easy to symbolize those tendencies by invoking two of the most famous market personalities, Jim Cramer and Warren Buffett. The fifth graphic might be a little extreme even for Cramer, since he does respond to some questions about stocks with a “don’t buy,” but he normally is willing to proclaim “buy” or “sell.” Buffett, on the other hand, not only plays the jovial monk to Cramer’s manic jester, but he also is willing to wait around a long time for that fat pitch, and deems many potential investments as “too hard” and stays on the sidelines. The degree to which a research firm tends to gravitate to one of those extremes makes a big difference in the pattern of its performance and how you should analyze it.
The distributions of ratings are born of the philosophies of the firms, and the extent to which they vary over time can provide important information for analysis. There is great value in studying the firms in a way that acknowledges the unique stated goal and approach of each — and considers the firm’s opinions on stocks in light of its own “normal” distribution, the companies it covers, and the market environment. One of the failings of most published summaries of research performance is that those elements are not taken into account.
A holistic examination is also useful for buy-side institutions wanting to evaluate their internal research and to compare it to the external sources of opinion that they receive, as well as the portfolios in which it is ultimately used. A careful review of that type can yield important hints about the strengths and weaknesses of a firm.
While stock recommendations by themselves don’t convey a lot of information, and institutional investors in particular say they mostly ignore them, they continue to be relied on in some quarters and are the hook on which the labels of “best” and “worst” are often hung. Knowing why a firm’s distribution of ratings is what it is — and how it moves over time and for what reasons — can yield helpful clues about the investment choices you make in response, and whether ratings-level information adds any value to your decision making process.

